
-
Planning for Evaluation
SEIR*TEC Home | About SEIR*TEC | Partners | SEIR*TEC Region | Search
-
Priorities, Questions, & Indicators
-
- In this section:
As mentioned in Section I of this evaluation Web site, "Getting Started," one type of evaluation is known as needs assessment or conceptualization studies. Before a technology project is ever designed or implemented, most schools or districts will conduct an internal evaluation to determine and prioritize their needs (i.e., What have we done so far? Where are we going? How can we get there?). To help with defining the needs in a school or district by way of needs assessment, a number of resources are available:
|
Developed by the CEO Forum on Education and Technology, the STaR Chart identifies and defines four school profiles ranging from the "Target Tech" school that provides a model for the integration and innovative use of educational technology. The STar chart is not intended to be a measure of any particular school's technology and readiness, but rather to serve as a benchmark against which every school can assess and track its own progress. |
Developed by SEIR*TEC, the Progress Gauge is used to help school leaders reflect on activities to date in technology integration, think about what needs to be done in order to impact teaching and learning through the use of technology resources, and consider strategies for maximizing the impact of technology. The SEIR*TEC Progress Gauge is also available in an online format in conjunction with the HPR*TEC Profiler tool. |
|
Developed by the High Plains Regional Technology in Education Consortium (HPR*TEC), the Profiler tool and ready-to-use surveys offer a means to strengthen people's understanding of a topic such as staff technology skills or technology support needs in a school. Surveys can be customized for a group and stored on and accessed form the HPR*TEC server. Surveys can be used for teachers to self-assess technology skills and also to find other teachers in their school who can help to strengthen these skills. |
The Quality School Portfolio, developed by the National Center for Research on Evaluation, Standards, and Student Testing at UCLA (CRESST), is a decision-support system designed to help educators collect, analyze, and interpret student data. It includes tools to set goals and determine desired targets of student progress, and allows for the collection of student work samples to compare over time.
|
|
Taking a Good Look at Instructional Technology (TAGLIT) is a suite of assessment tools designed to help principals and other school leaders gather, analyze, and report information about how technology is used for teaching and learning in their schools. |
The Toolbelt contains a set of surveys and checklists to help educators collect data about professional practices, classrooms, schools, communities, and districts.
|
Evaluation Questions from Models
Evaluation questions are closely tied to models of evaluation. Different evaluation models emphasize different things. Some models suggest that you focus only on the goals and objectives for your project, evaluating the extent to which those have been met. Other, more contemporary models, suggest that you also focus on the underlying context in which the project took place. For example, one decision-based evaluation model entitled CIPP (context, input, process, and product) encourages a closer look at project context (Stufflebeam & Shrinkfield, 1985). In the CIPP model, evaluation questions are written to address four core areas:
- Context questions are written to identify needs of target populations and opportunities to address those needs, to determine how well project goals address stated needs;
- Input questions are written to define capabilities, project strategies and designs, the goals (e.g., equipment, facilities, staff);
- Process questions are written to define deficiencies in the process or implementation, how were resources allocated, and what barriers threaten the success; and
-
Product questions are written to define outcomes, judge their worth, and describe lessons learned from the project.
|
The Flashlight Model
|
The Logic Model
|
|
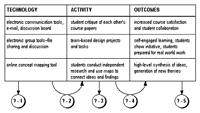
One of the most helpful models for writing evaluation questions is known as Flashlight (TLT Group, 2002). For evaluating a technology project, the Flashlight model recommends the development of "triads." A triad consists of the type of technology you might employ (T), a specific activity that the technology enables (A), and outcomes expected fro that type of Activity (O).
With the key components of the technology project laid out, evaluation questions can be generated about the three categories and the intersections between them:
The key lesson from the Flashlight model is that technology is best evaluated as a "tool" to accomplish certain activities or strategies. As learned from decades of research, it is not the tool that leads to desired outcomes, but rather the activities and strategies. For this reason, the Flashlight model shows no direct relationship between technology and outcomes, and encourages evaluators to focus on relationships that will yield more significant data. |
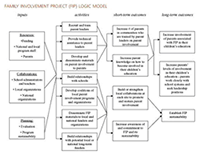
Another model that can help you plan evaluation questions is the "logic model" developed by the Harvard Family Research Project (Coffman, 1999). The approach begins by defining the scope for the model--is it focused on one goal, a few goals, or the entire project? For the purpose of evaluation, it may be useful to create several logic models, one for each separate goal area. However, if goal areas are interrelated, keeping them together in one logic model will better allow you to focus on important relationships. Each logic model contains four elements:
An individual can create a logic model by using concept mapping software such as Inspiration, or small groups can create logic models by using flip chart paper and post-it notes. Lines should be drawn between key components to show which inputs feed into which activities, which activities feed into which short term objectives, and so on. Once completed, the logic model can serve as your evaluation framework. Indicators (described below) can be developed for each component in the model (e.g., number of parents volunteering in after-school programs). And data sources can be selected to determine if those indicators have been met (e.g., surveys, observations, interviews).
|
RESOURCE: For more information on the development of evaluation questions, read "Evaluation Questions: Guiding Inquiry in Schools" by Ann Abeille, Director of Research and Evaluation, Learning Innovations as WestEd.
RESOURCE: For more information on logic models, read "Learning From Logic Models: An Example of a Family/School Partnership Program" by Julia Coffman, Harvard Family Research Project.
Indicators should be tied to your goals and evaluation questions. If a goal states, "Students will be technologically proficient in accordance with district technology standards," and the related question asks, "Are students technologically proficient in accordance with district technology standards," indicators should specify the criteria by which that goal will be met and that question will be answered (e.g., students can word process, students can create a Web page, students use the Internet for research, etc."
An indicator is a continuous factor used to describe a construct of interest. For example, indicators might include: the unemployment percentage, the density of single family developments in a metropolitan statistical area (lots per acre), the number of miles of bike trails in a county, the national rate of violent crime (acts per 1000 citizens), the percentage of county students participating in reduced or free lunch programs, the school percentile on the state math assessment, or the number of students who use the Internet for research. Indicators are continuous because they may have some historical or past value, they have a current value, and they will have a future value. The value is assumed to be in flux, and more importantly, it can be changed for the positive through the projects that we are evaluating.
Indicators are used to inform stakeholders about the current state of affairs (i.e., is the situation improving, getting worse, or staying the same). Indicators can also be used to estimate the future based on the past (see benchmarking below) (i.e., historically, the rate of growth is 1% per year, so we expect a 1% increase this year). And finally, an indicator in one area may be used to predict a new indicator in a related area (e.g., school math scores improved to the 85th percentile three years after implementing project X in the discipline, thus we predict school reading scores will improve to the 85th percentile three years after implementing project X in that discipline).
Sample indicators and benchmarks are listed below.
RESOURCE: For more information on sample indicators, read "Alabama Indicators for Measuring Progress" by Melinda Maddox, Coordinator, Office of Technology Initiatives, Alabama Department of Education.
RESOURCE: For more information on indicators, read "Steps in Evaluating a School or District Technology Program" by Jeff Sun, Sun Associates.
Benchmarks are closely tied to indicators. If an indicator of interest is, "the number of students who use the Internet for research," then your benchmark would specify the time-interval at which you hope or expect to see improvements or gain in this measure. If you know, for example, that 40% of students used the Internet for research last year, you may expect 60% to use the Internet this year based on changes to the school curriculum brought about through your project. In year two, you may expect 80% to use the Internet, and in year three, 100%. Benchmarks specify the degree to which an indicator or criterion should be reached in order for the project to be deemed a success.
When companies define benchmarks, they often look to competitors and their reported values on such indicators as customer satisfaction and product reliability. To set benchmarks for your technology plan or project, then, you may find it useful to review the results of successful projects similar to your own. What gains were expected? What gains were seen?
Sample indicators and related benchmarks
|
Goal
|
Indicator
|
Benchmark
|
|
By May, all students will have equitable access to technology, including network and Internet-based resources within labs, media centers,classrooms, and homes.
|
50 wireless computers will be purchased. | The number of wireless computers on mobile carts will increase from 10 in Year One to 30 in Year Two, to 50 in Year Three. |
| Each School will add one wireless access point. | By Oct. 1, each school will have installed wireless access points. By Nov. 1, all wireless computers will be configured to reach access points. | |
| The district will create 10 classroom mini-labs consisting of five workstations, scanner, printer, and digital camera. | By Oct. 15, mini-lab equipment will be ordered. By Nov. 15, mini-lab equipment will be installed in 10 classrooms. By Dec. 15, teacher orientation training will be conducted. | |
| The student computer ratio in classrooms will 6:1 in all classrooms. | The current student computer ration of 20:1 will decrease to 10:1 in Year One, and 6:1 in Year Two. | |
| 50 new software titles will be purchased according to needs identified in teacher surveys. | By Nov., available software will increase from 20 titles to 50 titles. | |
| The school Web site will provide access to teacher email to aid in parent-teacher communication. | By March, 50% of teachers will have email, and by May 100%. | |
| The district will provide dial-up access for 50 laptop computers in the district checkout program. | 10 laptop computers will be available for check out in Sept., 25 in Nov., and 50 in Jan. |
RESOURCE: For more information on and sample benchmarks, read "Alabama Indicators for Measuring Progress" by Melinda Maddox, Coordinator, Office of Technology Initiatives, Alabama Department of Education.
RESOURCE: For more information on and sample benchmarks, read "State Guidelines for Enhancing Education Through Technology Projects" by Tammy Mainwaring, Education Associate, Professional Development and Instructional Technology Office, South Carolina Department of Education.
After specifying evaluation questions and linking those to indicators and benchmarks, the next step in the evaluation process is to collect data that will help you show progress towards the benchmarks. Having specified indicators and benchmarks, you are already half-way to choosing appropriate data sources and instruments. For example, if you need to document a 20% increase in the number of students using the Internet for research during each year of your project, you may choose to examine school lesson plans for evidence of those activities across classes. Alternatively, you may choose to survey the student body about the types of activities they participated in during the school year.
Section III. on this Web site will better explain the process of data collection. at this stage in evaluation planning, you may find it useful to generate a table that outlines your evaluation questions, related indicators, and benchmarks. Next, you will match appropriate sources of evidence and instruments to help you define the extent to which you have attained the benchmark.
|
Question
|
Indicators
|
Benchmark(s)
|
Data Sources, Instruments
|
Results, Changes, Outcomes
|
|
|
|
|
|
|
References:
Coffman, J. (1999). Learning from logic models: An example of family/school partnerships program. [On-line]. Available: http://www.gse.harvard.edu/~hfrp/pubs/onlinepubs/rrb/learning.html
Scriven, M. (1980). The Evaluation of College Teaching. Syracuse, NY: National Dissemination Center, Syracuse University Scholl of Education.
Stufflebeam, D. L., & Shrinkfield, A. J. (1985). Systematic Evaluation. Boston: Kluwer-Nijhoff.
TLT Group. (2002). Flashlight Program. [On-line]. Available: http://www.tltgroup.org/programs/flashcsi.html